Monitoring
Anomalies in sensor data
Deviations from the normal patterns of a device or installation are detected automatically, and an alert goes out before the issue becomes a failure or a service call.

Industries · Energy & IoT
theBlue.ai builds custom AI systems that read sensor data from devices and energy installations, detect anomalies and failing sensors, classify operating states and run on the device where the connection is limited. Each system connects to your IoT platform, data warehouse and service systems or your own applications, in the cloud, on-premise or at the edge.
AI in energy and IoT evaluates measurement series from plants, grids and devices. It detects deviations from normal operation, finds faulty sensors and classifies operating states.
In operations and maintenance this supports the monitoring of distributed assets and the planning of site visits. Results go to the control system, the maintenance software or the company’s own IoT platform.
The gain: irregularities surface earlier, maintenance can be planned instead of awaited and faulty readings distort the analysis less often. Interventions in operations stay with the specialists.
Project example · Global HVAC manufacturer
A global manufacturer of heating and air conditioning systems had a fleet of IoT devices sending a continuous stream of temperature, pressure, humidity and airflow data. Maintenance stayed reactive, and a failing sensor went unnoticed until it caused a visible problem. We built the data architecture and the machine learning pipelines that now read the data.
Some of the organisations we have built for















What AI takes over
Energy and IoT companies collect more data than any team can watch. AI takes over monitoring, maintenance planning, operations, forecasting, field service and customer service.
Monitoring
Deviations from the normal patterns of a device or installation are detected automatically, and an alert goes out before the issue becomes a failure or a service call.
Data quality
Correlations between groups of sensors show which sensor has stopped telling the truth, even when there is no reference to compare against.
Operations
Models recognise what each device or installation is actually doing and show how the fleet is really used in the field.
Maintenance
Condition data from turbines, inverters, heat pumps or grid equipment shows when service is needed, and technicians go out based on the actual state.
Forecasting
Historical meter data, weather and calendar effects are combined into forecasts for consumption and generation, prepared for the planning team.
Buildings
Heating, cooling and ventilation are adjusted to indoor and outdoor conditions, and the effect of each operating mode on the room is measured.
Edge
Models run directly on compact devices, keep working without an internet connection and send only results. Raw data and video stay where they are recorded.
Field service
Technicians ask about manuals, wiring diagrams and past service cases by text or voice on site and get the answer with the source.
Customer service
Emails about bills, tariffs and moves are sorted, meter readings are pulled out of messages and photos, and the data is entered into your billing system.
How it works
In standby, supply temperature keeps rising. Pressure sensor P3 has not changed for 36 hours.
The compressor starts twice as often as in similar units.
Unit 0417 · assessment
Illustrative example with invented data, based on the HVAC sensor analytics case study.
Built for energy and IoT
Large, noisy data streams, hardly any labelled examples and devices in places without a stable connection.
Ingestion, processing and storage come before the models, and every later use case builds on the same foundation.
Where no labelled examples exist, the models learn normal behaviour directly from the raw readings.
Models process data locally when the connection drops and sync once it returns, in a remote installation or on a moving vehicle.
The system detects, classifies and suggests. Service visits, operating changes and every decision stay with your engineers.
Case studies
Our sensor analytics project for an HVAC manufacturer, and two IoT projects: the state of elevators from a minimal set of sensors, and people counting on the device.
Energy & building technology · under NDA
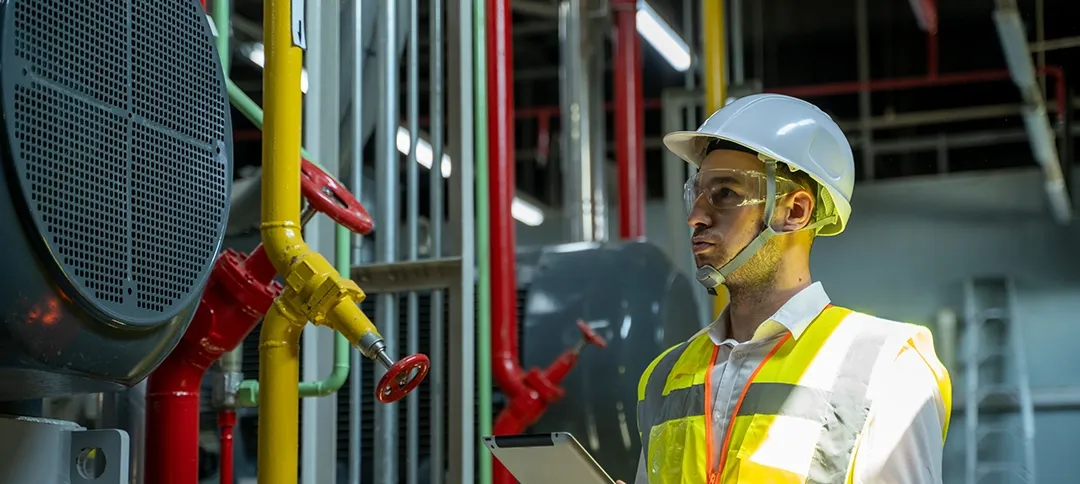
Engineers reviewed sensor data from HVAC systems by hand to spot irregularities. AI now watches continuously, detects anomalies, classifies operating modes and flags issues before they escalate.
Read the case study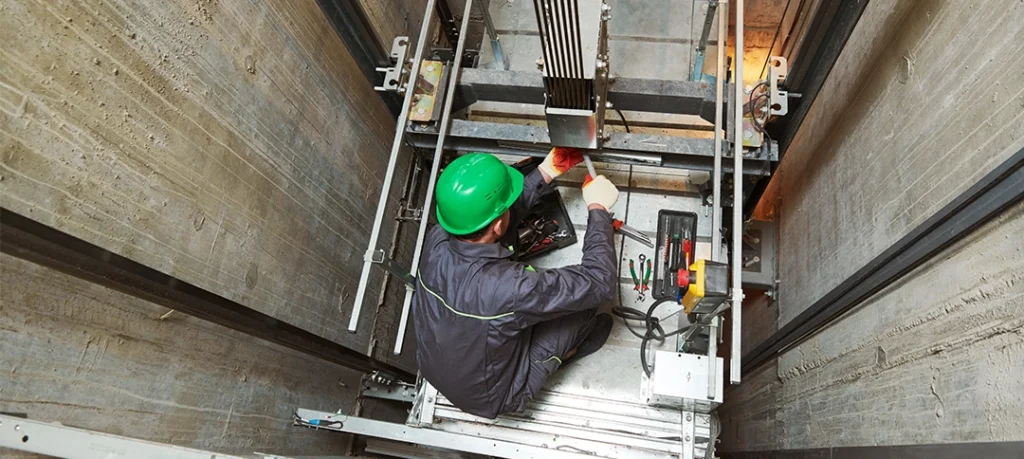
Manufacturing & IoT · under NDA
Maintenance teams inspected elevators by hand to determine their status. A model now reads position and operating state from few sensors, which lays the groundwork for fleet-wide predictive maintenance.
Read the case study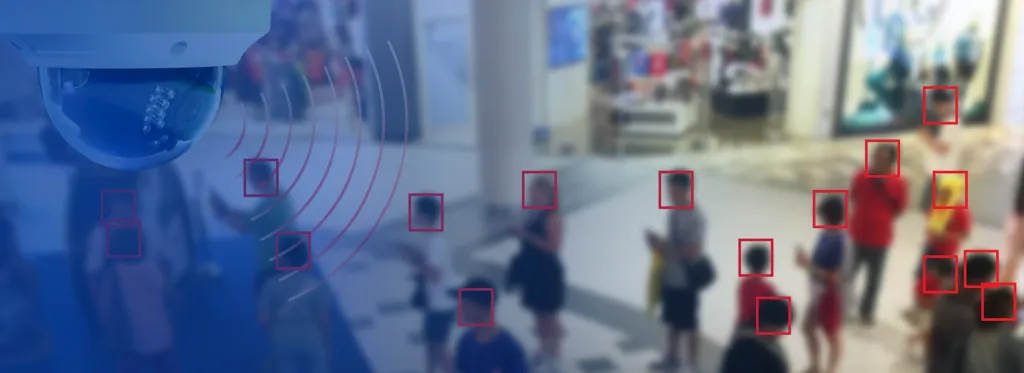
IoT · RapidLab
Staff counted visitors by hand or relied on inaccurate sensors. We built the model for edge devices, deployed in buildings and public transport, running without a cloud connection.
Read the case studyHow to start
A sensor stream, a maintenance plan or a customer inbox: the work your team does by hand today, and the data it runs on. We check early whether the data carries the use case and where it may be processed.
Tell us where the manual work sits and which data it involves. We come back within one business day with an initial assessment and a proposal for a 30-minute scoping call.
Describe your processWorkflows mapped, your data sources and requirements checked, and an architecture proposed with scope, timeline and cost. A standalone engagement with no commitment to proceed.
See the AI Discovery WorkshopFAQ
In energy and IoT, AI takes over work that engineers and service teams otherwise do by hand: anomalies and failing sensors in sensor data, operating states of devices, predictive maintenance, consumption and generation forecasts, building operation, models running on the device, answers for field technicians and customer emails with meter readings. The AI system prepares the result, and engineers and service teams decide.
Yes. For a global HVAC manufacturer with more than 100 devices in the field, each with 50 or more sensors, theBlue.ai built machine learning pipelines that detect sensor and device malfunctions from deviations in the normal data patterns. Automated alerts replaced manual monitoring, so an issue surfaces before it becomes a failure or a service call.
That is common with sensor data. For the HVAC manufacturer theBlue.ai used clustering on the correlations between groups of sensors to find abnormal behaviour. For an elevator manufacturer the models learned position and operating state directly from raw readings of a deliberately minimal sensor set.
Yes. With RapidLab theBlue.ai built compact devices that count people from time-of-flight sensor data or camera images with all inference on the device, with no internet and no video leaving the doorway. The elevator models process and store data locally while the connection is down and sync once it returns.
With the data architecture. For the HVAC manufacturer theBlue.ai first built ingestion pipelines, processing and storage on AWS with Apache Airflow, AWS Glue, Athena and Azure IoT Hub, and then delivered five use cases on top: sensor reliability, operating mode classification, anomaly detection and environmental impact.
With one process, such as anomaly detection for one device type, and the data behind it. The process analysis has a fixed price from €3k and ends with an architecture proposal that states scope, timeline and cost, including where the data may be processed. The build is priced in milestones, and first working components typically arrive six to eight weeks in.
Describe the process and we’ll come back within one business day with an initial assessment and a proposal for a 30-minute scoping call.